Tag: food assistance

  • Become a L.I.F.E. Life Saver today

    Become a L.I.F.E. Life Saver today

    Loveland, Ohio

    Take part in the 2024 LIFE Food Pantry Annual Fundraising Campaign, which will raise awareness and donations for LIFE‘s many programs that serve the northeastern suburbs of Cincinnati and the entire 45140 zip code. Keep reading for ways to get involved this year!

    Our services are dependent on the generosity of our wonderful community and there are so many ways you can get involved:

    MONETARY SUPPORT
    A monetary contribution to our annual contribution helps us keep our programs thriving and able to meet the growing demand of our neighbors. Click here to donate online.

    FOOD DONATIONS / FOOD DRIVES
    Help stock our shelves by dropping off food items during our normal business hours or host your own food drive! We can help! Click here or email fooddrives@lifefoodpantry.org to learn more about food drives.

    SPREAD THE WORD
    Tell everyone about LIFE Food Pantry and the work we do for the community. Download and post a BE A LIFE SAVER flyer or spread the word through social media by clicking on these icons:

    CORPORATE PARTNERSHIPS
    The Greater Loveland business community is integral to the success of LIFE. Please consider becoming a partner for the 2024 calendar year. Click here to see the perks of being a LIFE Corporate Partner.

  • Ohio Senate budget attacks poor people on food assistance, affordable housing, and other programs

    Ohio Senate budget attacks poor people on food assistance, affordable housing, and other programs

    COMMENTARY

    by Rob Moore – Ohio Capital Journal

    The Ohio Senate Republican budget passed last week put forth a new vision for social safety net spending in Ohio.

    The proposal suggests reduced spending on food banks, housing for pregnant women, affordable housing, and school meals for poor children. It also proposes making it harder for low-income people to get access to Medicaid, SNAP (formerly known as “food stamps”), and other public benefits.

    These changes to the budget are used to fund income and commercial activity tax cuts.

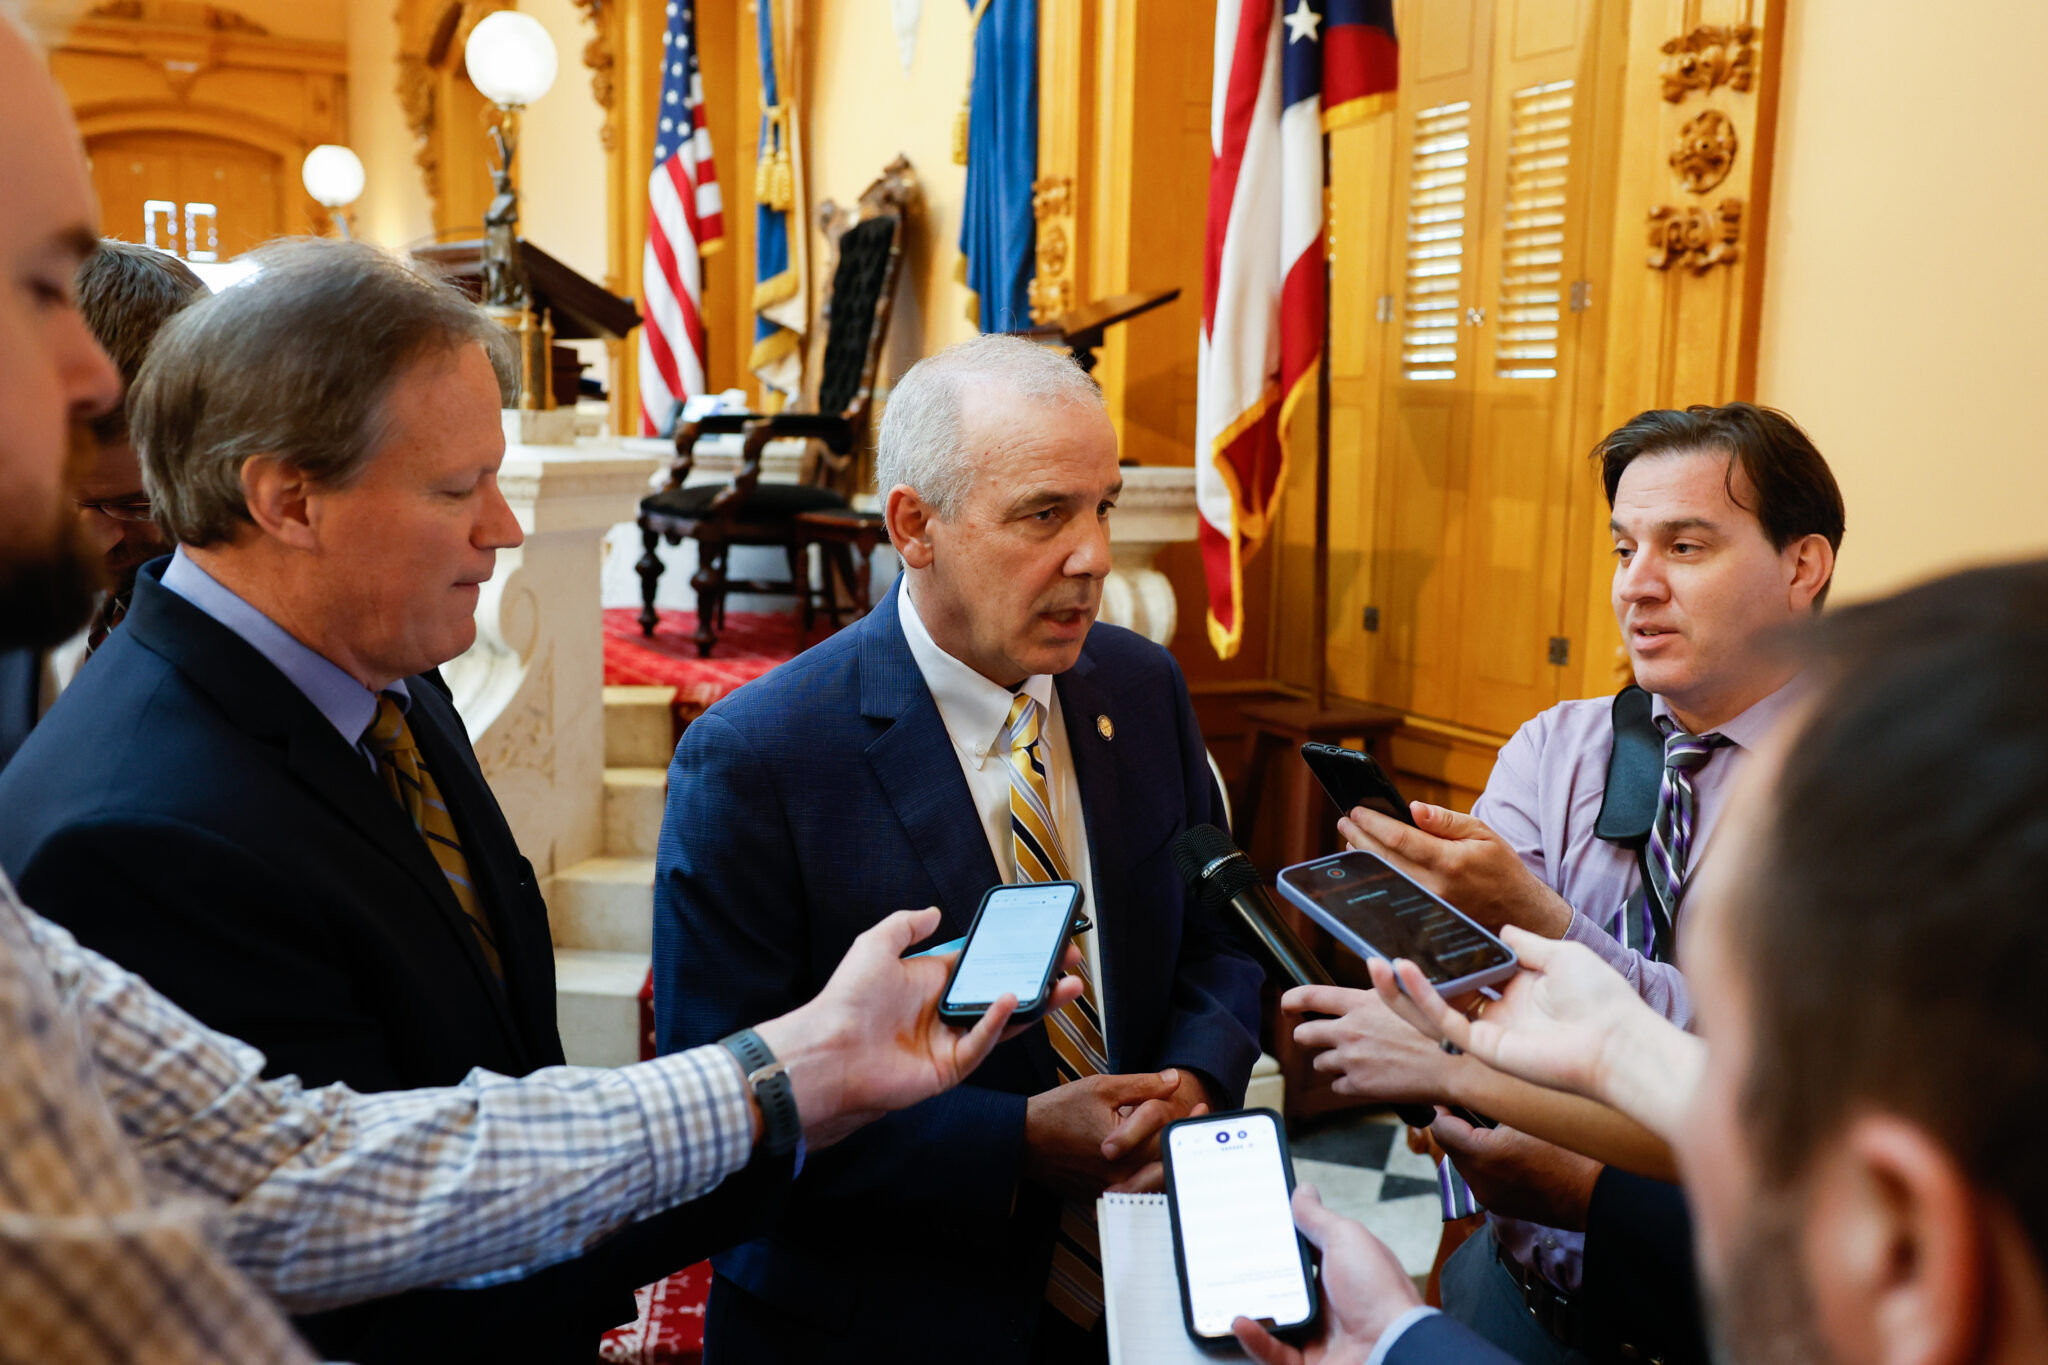
    When Senate President Matt Huffman was asked about this range of cuts to social services, his explanation was that he is trying to “stimulate” a conversation about sustainability of the Temporary Assistance for Needy Families fund. He expressed worry that the fund would be insolvent in five years if spending and revenue continues at current levels for years into the future.

    So let’s talk about it.

    Temporary Assistance for Needy Families (often shortened to “TANF”) is a relatively small program that mainly provides income to very poor Ohioans. It is the successor to the Aid for Families with Dependent Children (AFDC) program. This was the program that had gained the dreaded label of “welfare” in the early 90s.

    Many politicians did not like AFDC because it gave cash to low-income families. It became a massive dog whistle punching bag for the Reagan administration, who was able to vilify it to such effect that it was ultimately the Clinton administration that finished the program, following up on a campaign promise to “end welfare as we know it.”

    And he did. The new TANF program was a block grant given out to states to not only provide cash assistance, but also to pilot a range of different programs focused on getting people to work.

    Early on, this change was seen as a success. Poverty abated and employment, especially among single mothers, increased. But this was the 90s–a period of economic expansion.

    The subsequent recession of the early 00s followed by the Great Recession of 2007 to 2009 exposed how these changes to the social safety net had made it less resilient and kicked out many of the supports previously in place to hold struggling families up.

    While new programs from the 90s like the earned income tax credit are a good tool for supporting families who have work, they fail when structural problems make work unavailable on a massive scale.

    All this is to say Huffman has a little bit of a point here. Block granting TANF took one of the most straightforward and effective income support programs in U.S. history and capped it, limiting its potential effectiveness greatly. Now the dollars available for supporting low-income families need to come from somewhere else.

    Is the answer to this problem to cut social spending left and right and use that as a tool to fund income tax cuts and cuts to commercial activity? Probably not. If the plan put forth in the Senate is adopted, it will represent a massive transfer of income from the most needy Ohioans to those with the most resources already. Seems like a big cost to try to make a point.


    Rob Moore
    ROB MOORE

    Rob Moore is the principal for Scioto Analysis, a public policy analysis firm based in Columbus. Moore has worked as an analyst in the public and nonprofit sectors and has analyzed diverse issue areas such as economic development, environment, education, and public health. He holds a Master of Public Policy from the University of California Berkeley’s Goldman School of Public Policy and a Bachelor of Arts in Philosophy from Denison University.

    MORE FROM AUTHOR

  • 100,000 who receive food assistance in Hamilton County alone to be affected by Federal shut-down

    100,000 who receive food assistance in Hamilton County alone to be affected by Federal shut-down

    Your next food card re-load must last for 2-1/2 months

    Ohio residents who receive re-occurring food assistance benefits will see their food cards loaded with February benefits on Wednesday, Jan. 16, due to the Federal government shutdown. The benefits, however, must last them until their normal March load date, which could be as much as two and a half months away.

    Moira Weir, director of Hamilton County Job and Family Services, will meet with the Board of County Commissioners tomorrow to discuss the early issuance of food assistance, which has not been done before, to her knowledge.

    “We realize how scary this time is for some members of our community and we want everyone to know we are going to help in any way possible.”

    She said it is important the county’s 100,000 food assistance recipients realize these should be treated as a normal February issuance and made to last until March.

    “We know how important this benefit is to some Hamilton County families and we are extremely happy it is available,” she said. “But there is some worry that people will see the extra benefit and be confused, perhaps using it without realizing it needs to last until the normal March date when their food cards would next be loaded.”

    In addition to the re-occurring cases, those consumers who are applying for a new case or are re-applying and are in pending status, must get their verification information in and authorized by Jan. 30 to receive their February benefits.

    Weir said the agency has not received any notice that Temporary Assistance to Needy Families (Ohio Works First), Medicaid or Child Care funding will be affected by the shutdown. She also noted that flexible Prevention, Retention and Contingency funding is available should the shutdown continue to the point people lose benefits and help with issues that arise. 

    “The flexible funding could be available in emergencies to those who qualify,” she said. “We realize how scary this time is for some members of our community and we want everyone to know we are going to help in any way possible.”


  • Working for less: Most common Cincinnati jobs pay too little

    Working for less: Most common Cincinnati jobs pay too little


    Last year, six of Ohio’s 10 most common jobs paid so little that a typical worker would need food assistance to feed a family of three — generally less than $26,000 a year.

    From the booming Columbus metro area to struggling Youngstown, too many jobs across Ohio don’t pay enough for families to get by.

    The research by Hannah Halbert, with research assistance from Isaac Miller of Policy Matters Ohio shows that too many jobs in Cincinnati pay too little and many pay less as a share of poverty than they did nearly two decades ago. New data released by the U.S. Department of Labor show that six of the Cincinnati area’s 10 most common jobs pay the typical worker too little to feed a family of three without food assistance (earnings under 130 percent of poverty typically qualify).

    At a time when state and federal policymakers are determined to erect new barriers to food assistance and health care, these new data show that the challenge is not requiring people to work, as most already do. Rather, the true challenge is getting employers—many of which are major international corporations with vast profits—to pay their workers a fair wage with benefits and set a schedule that provides some measure of job security.

    Low wages were not always so ubiquitous in the Cincinnati area. In 2000, five of the 10 most common occupations paid so little that a family of three was left dependent on food assistance to get by- now it’s six. Some occupations paid less as a share of poverty in 2017 than they did a decade and a half ago. The new rules of Ohio’s labor market are so tilted in favorof corporate employers that many Cincinnatians will not be able to work their way to self-sufficiency.

    The fact sheet for the Cincinnati area shows the median annual salary and hourly wage of the metro area’s 10 most common jobs in 2000 and 2017, and how far they went towards lifting a family of three out of poverty. The fact sheets also contain data showing which sectors have grown and which have declined since 2017.

    “State and federal leaders are trying to create new barriers to health care, food aid and housing assistance. If they succeed, many of Ohio’s working people will slip deeper into poverty.”

    “Throughout Ohio, not only are many of the most common jobs paying extremely low wages, many do less to lift working people out of poverty than they did in 2000,” Policy Matters Ohio Researcher Hannah Halbert said. “State and federal leaders are trying to create new barriers to health care, food aid and housing assistance. If they succeed, many of Ohio’s working people will slip deeper into poverty.”

    Working for Less

    Most common occupations in the Cincinnati metropolitan area, by employment, 2017

    page1image249770912

    Top 10 occupations 2017

    page1image217104592

    page1image217105424 page1image249765312

    Total Employment

    page1image249740352 page1image249740960

    page1image130905248

    Median Hourly Wage

    page1image130904352

    page1image217588912

    Median Annual Salary

    page1image244367120

    page1image250051424

    Median annual earnings as a share of poverty

    page1image217478848

    Food Prep & Serving Workers, including Fast Food (-)

    31,720

    $9.18

    $19,090

    93%

    page1image244798304

    Retail Salespersons (+)

    page1image217744544

    page1image217739968 page1image217745712

    29,450

    page1image217738752 page1image217739360

    page1image311361328

    $10.95

    page1image131679936

    page1image251376128

    $22,780

    page1image311086592

    page1image311268128

    112%

    page1image310533488

    Registered Nurses (+)

    page1image310416304

    23,580

    page1image310671296 page1image311124144

    $30.80

    page1image310815104

    $64,050

    page1image215549680

    314%

    page1image310858720

    Laborers & Freight, Stock & Material Movers (+)

    23,190

    $13.59

    $28,260

    138%

    page1image215184304

    Cashiers (+)

    page1image215543760 page1image310612048

    21,320

    page1image215652512

    $9.50

    page1image215335488

    $19,760

    page1image311066384

    97%

    page1image310671568

    Waiters & Waitresses (-)

    page1image243739824

    page1image243737584 page1image215305264

    20,170

    page1image251501744 page1image251382944

    page1image311312368

    $9.16

    page1image310910736

    page1image311314928

    $19,050

    page1image311314128

    page1image310900752

    93%

    page1image310598160

    Customer Service Reps (-)

    20,080

    $15.31

    $31,840

    156%

    page1image310620112

    Stock Clerks & Order Fillers (+)

    page1image310664160 page1image310622480

    17,640

    page1image250848320

    $11.87

    page1image311348784

    $24,690

    page1image310629872

    121%

    page1image310682096

    Office Clerks (+)

    page1image310603856

    page1image310686304 page1image310684112

    17,440

    page1image311048528 page1image311049072

    page1image311392992

    $15.29

    page1image311392112

    page1image310718256

    $31,800

    page1image310716784

    page1image310704560

    156%

    page1image310703184

    Janitors & Cleaners, except Maids & Housekeeping (-)

    page1image310785024

    15,670

    page1image310998416 page1image310785920

    $11.42

    page1image310890320

    $23,750

    page1image310931392

    116%

    page1image310861072

    Source: Bureau of Labor Statistics (BLS), Occupational Employment Statistics (OES) Survey, May 2017 estimates, available at https://www.bls.gov/oes/tables.htm, accessed April 13, 2018. Largest detail occupations in Cincinnati MSA by employment. Median annual earnings shown as a share of the poverty threshold for a family of three in 2017 ($20,420). The gross monthly income threshold for food assistance is generally 130 percent of poverty. Red text highlights the occupations paying a typical wage below this threshold. (-) indicates a median wage lower than the state median for that occupation. (+) indicates a median wage higher than the state’s for that occupation. Note that Cincinnati MSA includes areas in Ohio, Kentucky and Indiana.


    “Examining statewide numbers, Ohio may look better off than it really is,” Halbert said. Although the state has recovered all the jobs lost during the recession, since 2007, 215,000 fewer Ohioans are participating in the workforce — pushing down last year’s statewide unemployment rate of 5 percent. Statewide data also masks deep regional disparities and wage stagnation.

    Wrong Direction

    Cincinnati MSA occupations, employment and median annual wage: 2000 and 2017

    page2image246072976

    Top 10 occupations 2000

    page2image133617088

    page2image133617920 page2image133764992

    Earnings as share of poverty

    page2image249264672 page2image249265280

    Top 10 occupations 2017

    page2image246396256 page2image245699808

    Earnings as share of poverty

    page2image249219232 page2image249234000

    Retail Salespersons

    119%

    Food Prep & Serving Workers, including Fast Food-

    93%

    page2image249010192

    Cashiers

    page2image246153216

    page2image248752912 page2image246255328

    102%

    page2image248753648 page2image248754256

    Retail Salesperson-

    page2image246204448 page2image246202368

    112%

    page2image246205168 page2image246205776

    Laborers & Freight, Stock & Material Movers

    page2image246345216

    141%

    page2image245632016 page2image245632624

    Registered Nurses+

    314%

    page2image245879536 page2image245876896

    Food Prep & Serving Workers, including Fast Food

    page2image249340816

    97%

    page2image246090064 page2image246090672

    Laborers & Freight, Stock & Material Movers-

    138%

    page2image245748448 page2image245749056

    General & Operations Managers

    402%

    Cashiers-

    97%

    page2image248731808

    Office Clerks

    page2image249460192 page2image249429248

    152%

    Waiters & Waitresses

    page2image246210304 page2image245862544

    93%

    page2image245526848

    Customer Service Reps

    page2image249213120 page2image249212576

    177%

    Customer Service Reps-

    page2image248631456 page2image249215696

    156%

    page2image249286976

    Registered Nurses

    page2image248793024

    page2image248793728 page2image248794208

    295%

    page2image245810992 page2image245811600

    Stock Clerks & Order Fillers-

    page2image246001696 page2image246002240

    121%

    page2image249017168 page2image249017776

    Waiters & Waitresses

    page2image245745968

    93%

    page2image245841888 page2image245922752

    Office Clerks+

    156%

    page2image245734976 page2image245735584

    Packers and Packagers

    page2image249530432

    120%

    page2image249314176 page2image245769328

    Janitors & Cleaners, except Maids & Housekeeping-

    116%

    page2image246013456 page2image246014832

    Source: BLS, OES Survey, 2000 Cincinnati MSA estimates and May 2017 estimates, accessed 4/13/18 at https://www.bls.gov/oes/tables.htm. Largest detail occupations in Cincinnati MSA by employment. Median annual earnings shown as share of poverty threshold for a family of three in 2000 ($14,150) and 2017 ($20,420). The gross monthly income threshold for food assistance is generally 130 percent of poverty. Red font notes occupations that have median annual earnings under 130% of poverty for a family of three. (+) indicates earnings increased since 2000, (-) indicates the earnings decreased since 2000, as a share of poverty. Note that Cincinnati MSA includes areas in Ohio, Kentucky and Indiana.


    “Ohio needs leaders who will make a renewed public commitment to working people,” Halbert said. “Both the nation and state have productive economies with abundant wealth. We can use policy to shape the economy to benefit working people. Only the lack of political will keeps leaders from passing policies to improve job quality, make education and training affordable and fund basic services like transit and childcare that help people work.”

    The Cincinnati region on average had 1,093,600 jobs last year. That’s 49,800 more jobs than in 2007, when the last recession began. The Cincinnati region has been a driver of the Ohio recovery. One of the top jobs, registered nurse, provides better earnings. This job relies in part on maintaining expanded health coverage. Yet, many of the jobs that have grown over recent years do not offer the same income or stability as those lost. Manufacturing took the biggest hit. Growing sectors, like leisure and hospitality, often pay poorly and lack benefits.

    Job quality has been eroded. Ohio tax policy has sent big cuts to the wealthiest, shrinking funding for education, infrastructure, and healthcare—investments that help working people and their kids get ahead.

    Job quality has been eroded. Ohio tax policy has sent big cuts to the wealthiest, shrinking funding for education, infrastructure, and healthcare—investments that help working people and their kids get ahead.

    Policy Matters Ohio has set out 10 policy priorities that help working people by raising wages, extending overtime protections, providing paid leave, preserving public jobs and more. These new data show that such policies are essential in the Cincinnati region where jobs still make it hard to get by.