

by David Miller
Loveland, Ohio – The City is within three Ohio counties: Clermont, Hamilton, and Warren. Within the corporate limits there are eleven voting precincts. We tallied the “Yes” and “No” votes for the State as a whole, the votes for or against in each county, and each precinct where Loveland residents live and go to the polls.
With 100% of the precincts reporting, here is how voters cast their votes on State Issue 1 in the August 8 special election. The issue to make it more difficult to circulate and pass citizen-led Ohio constitutional amendment was defeated by a 57% to 43% state-wide margin.
The Republican-led effort in the special August election that may have cost Ohio, taxpayers, more than 20 million dollars aimed to make amending Ohio’s constitution more difficult. Issue 1’s chief target was to raise the bar to 60% for passing an abortion rights measure that will be on the Fall ballot.
This outcome means that when Ohio voters go to the polls in November and vote on a constitutional amendment protecting women’s healthcare and reproductive rights, a simple majority of 50% plus one vote will still be the qualifying standard that will be required for passage as it has been for the past 111 years
Read about Ohio Issue 1(Official ballot language, explanation, arguments for/against, and full text)
_______________
Ohio (State-Wide)
YES – 42.99% – 1,315,346
NO – 57.01% – 1,744,094
_______________
Clermont (County-Wide)
YES – 54.32% – 31,108
NO – 45.68% – 26,160
Hamilton (County-Wide)
YES – 33.37% – 77,315
NO – 66.63% – 154,364
Warren (County-Wide)
YES – 52.79% – 37,990
NO – 47.21% – 33,972
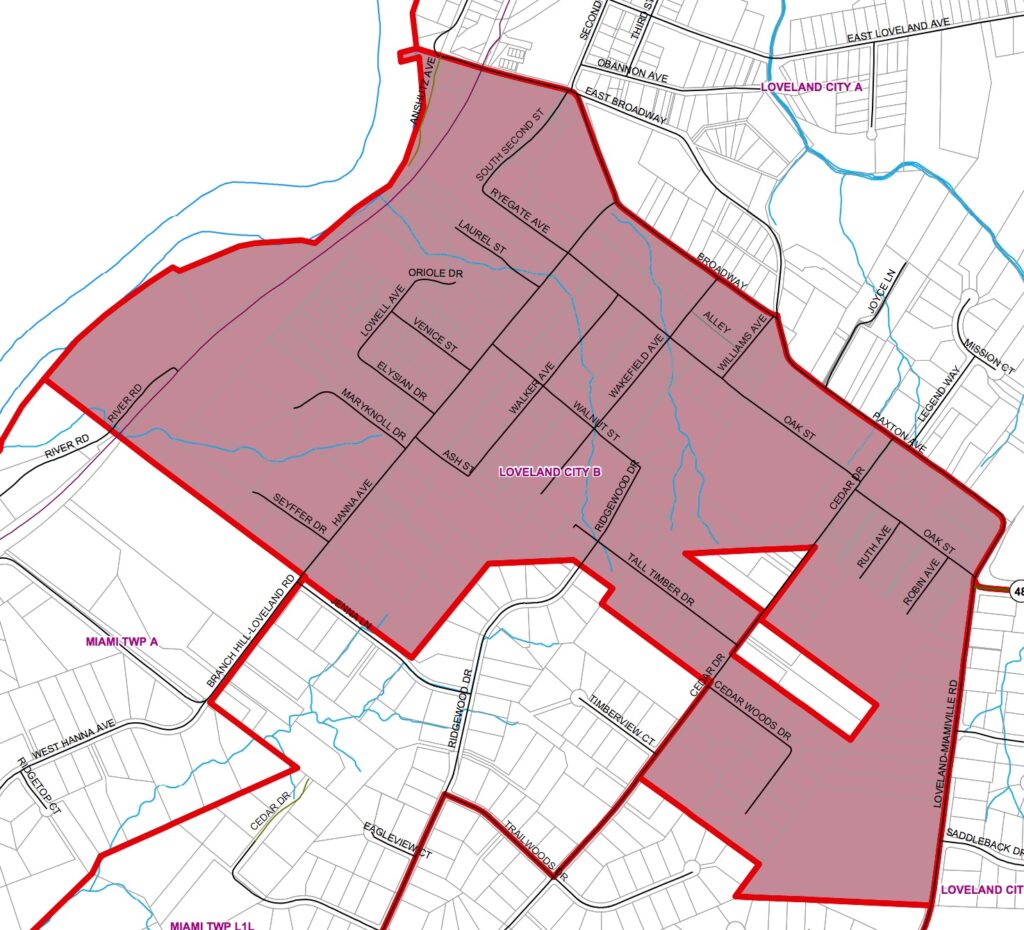
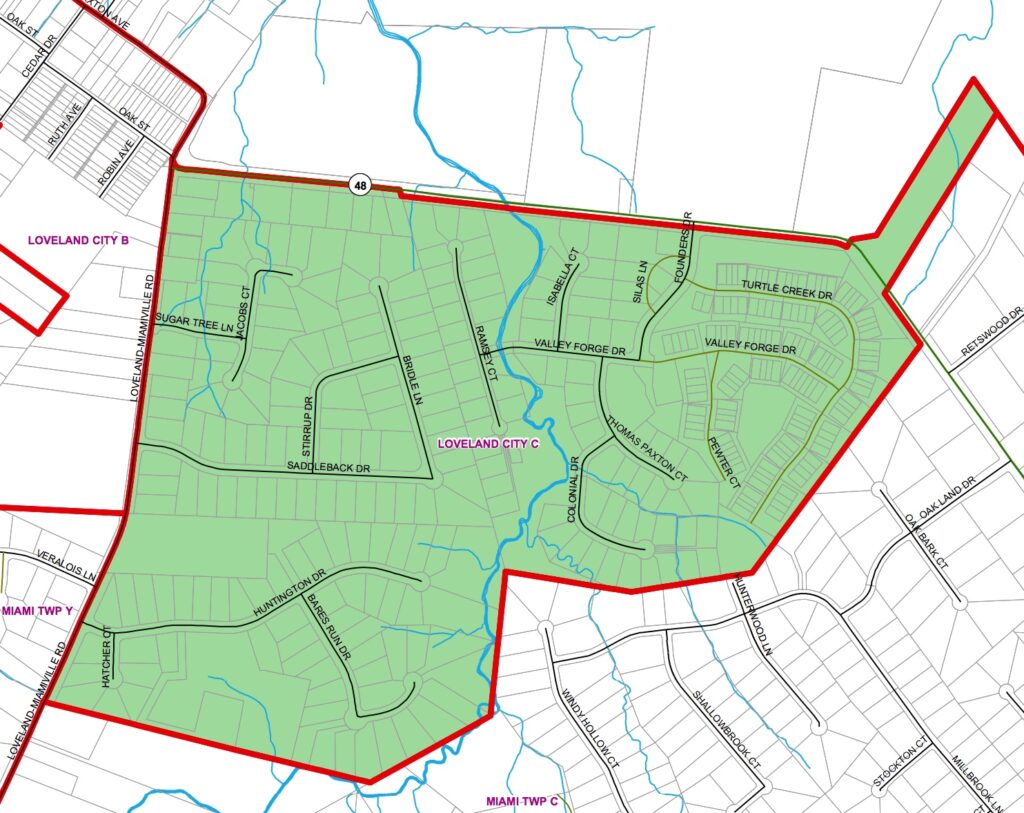
Loveland Hamilton County Precincts
Loveland A
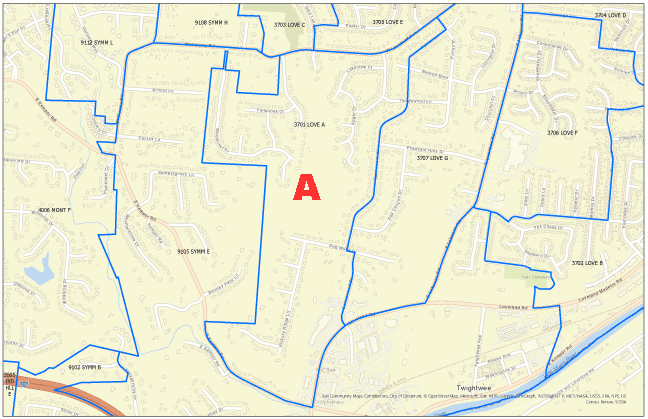
YES 43.78% – 197
NO 56.22% – 253
Loveland B
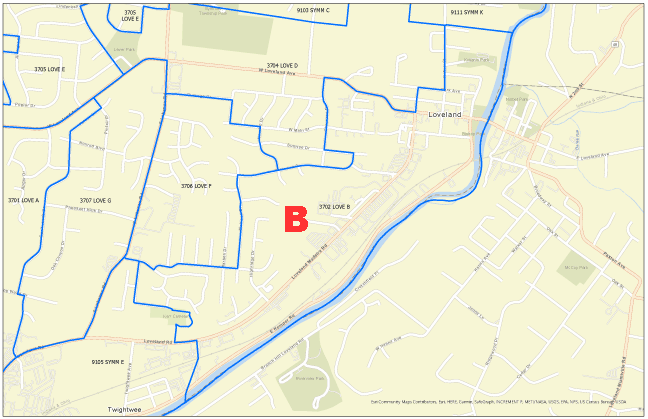
YES 34.47% – 203
NO 65.53% – 386
Loveland C
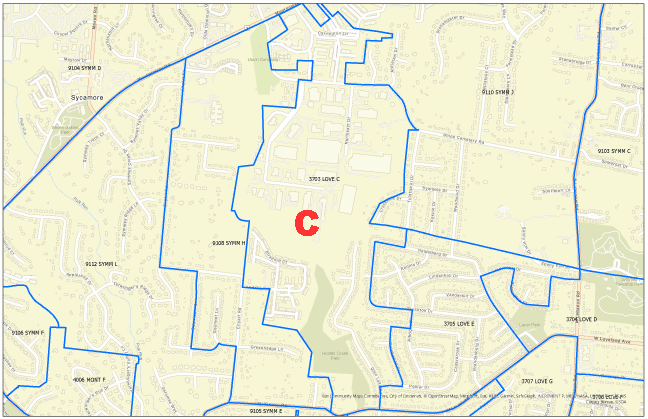 YES 40.00% – 184
NO 60.00% – 276
Loveland D
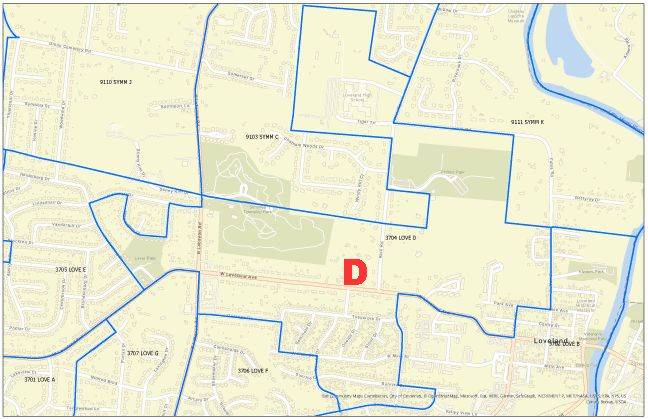 YES 36.49% – 131
NO 63.51% – 228
Loveland E
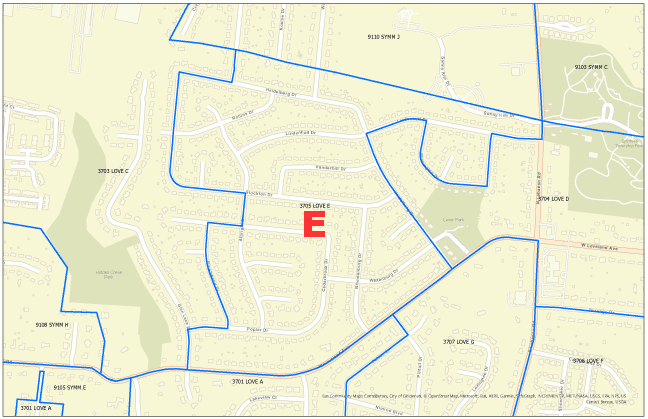 YES 43.83% – 206
NO 56.17% – 264
Loveland F
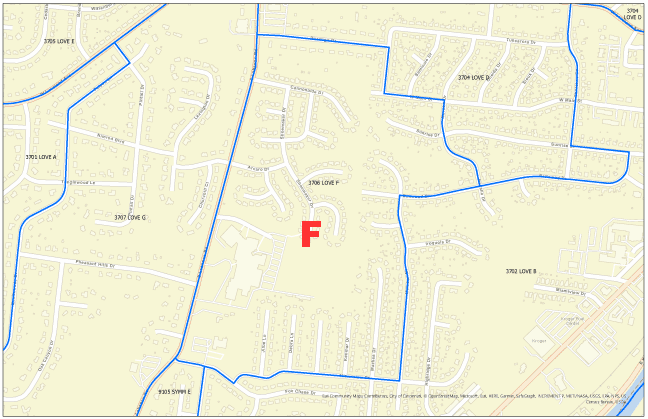 YES 36.32% – 138
NO 63.68% – 242
Loveland G
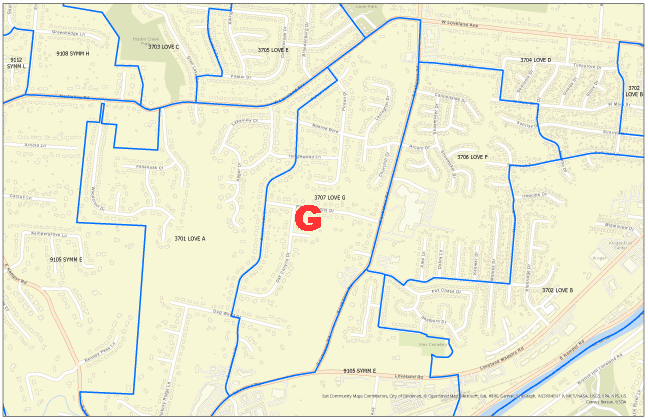 YES 39.23% – 142
NO 60.77% – 220
Loveland Clermont County Precincts
Loveland A
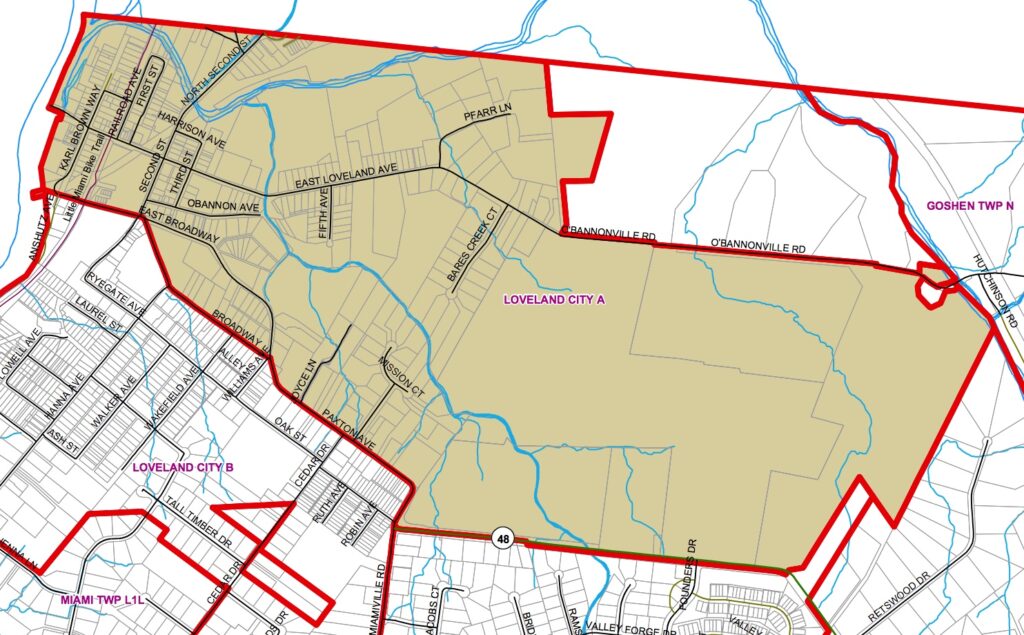
YES 46.03% – 116
NO 53.97% – 136
Loveland B
YES 32.20% – 95
NO 67.80% – 200
Loveland C
 YES 48.55% – 217
NO 51.45% – 230
Loveland Warren County (176) Precinct S
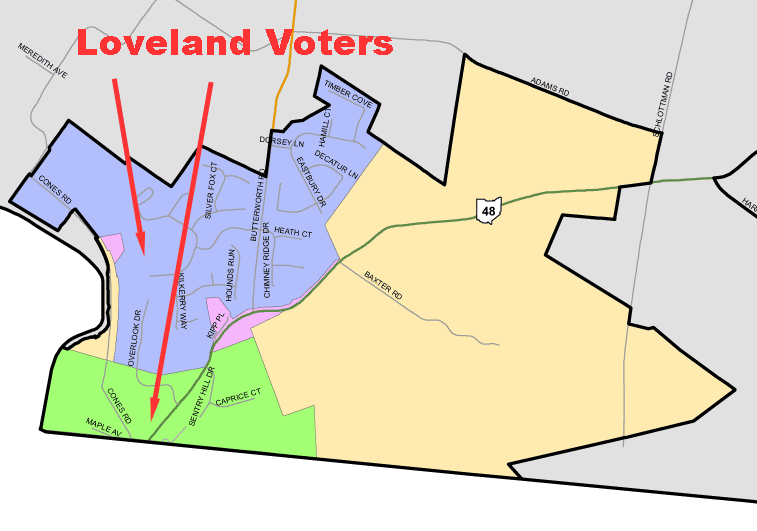
NOTE: This tabulation is for ALL voters in the precinct, but not all are Loveland residents.
YES 48.26%
NO 51.74%
Leave a Reply
You must be logged in to post a comment.