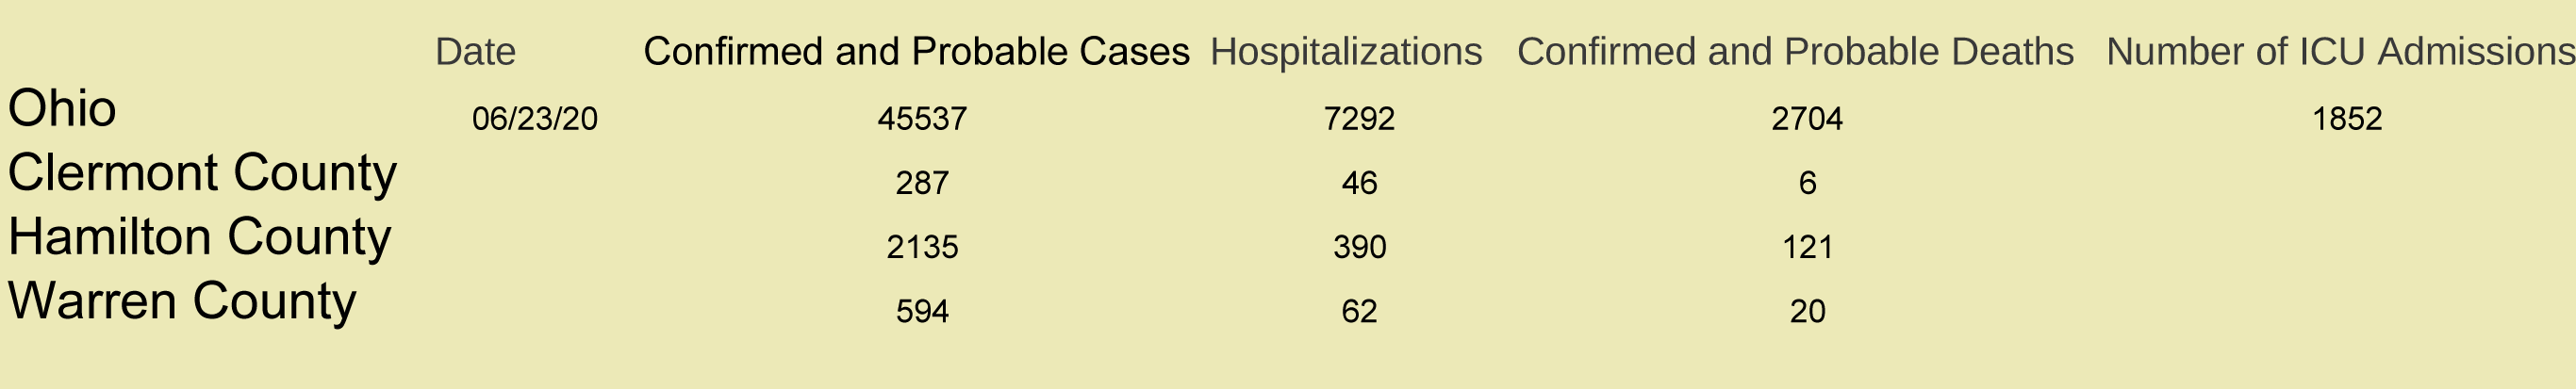
Loveland, Ohio – Here are the latest COVID 19 stats as reported by the agencies as of 10 AM Tuesday, June 23, 2020. Some data is not present because not all Health Districts report the same data.
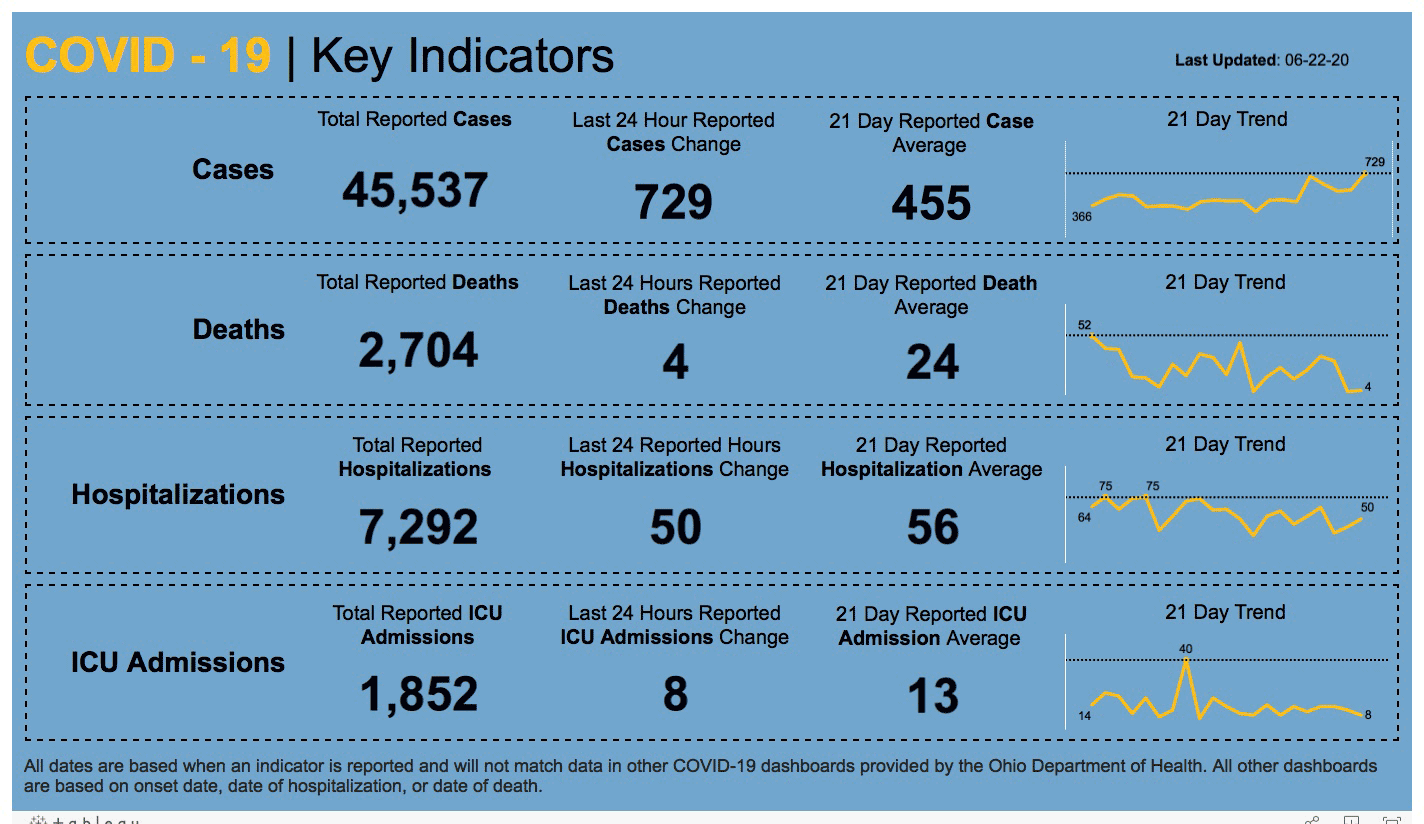
Here is the “Key Indicator” graph from the Ohio Department of Health reported on 6-22 *
(Right-Click and open in new tab or window to see a larger view.)